Validation of CERES-RICE Model
Sakda Jongkaewattana and Chirawat Vejpas
CERES-RICE Model (Ritchie et al., 1986), a physiologically based rice (Oryza sativa L.) model is selected as a tool in the project for simulating growth and yield of rice uder different environment and management strategies. However, prior to utilize the model with confidence, it is necessary to validate the model with local environment. Moreover, the estimation of genetic parameters of rice cultivars are needed in order to simulate Thai rice cultivars used in the study namely KDML-105, NSPT, CNT-1, and DOA1.
Estimation of genetic parameters and evaluation of CERES-RICE Model
A planting date experiment with monthly planting for 12 consecutive months, has been carried out at Multiple Cropping Center, Chiang Mai University started in May 1997. Data collection followed standard procedures suggested by IBSNAT (IBSNAT, 1988). Data obtained from the experiment are used to estimate genetic parameters using “Genotype Coefficient Calculator” which provided with the Decision Support System for Agrotechnology Transfer (DSSAT) shell (Tsuji et al., 1994).
Preliminary Results
With available data of the first four planting dates (May-August 1997), genetic parameters of rice cultivars used were estimated as shown in table 1. Simulation results suggest that the model provides good estimates of crop phenology events namely flowering and maturity dates (figure 1). However, the model overestimates grain yield of all cultivars (figure 2). These results suggest the potential yield of rice since the model assumes that there is no damage done on rice caused by pests or natural phenomenon such as shattering of grain and lodging of rice stand. Additional data from the rest of planting date treatments will be used to fine tune the genetic paramters.
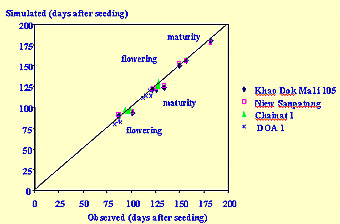 Figure 1
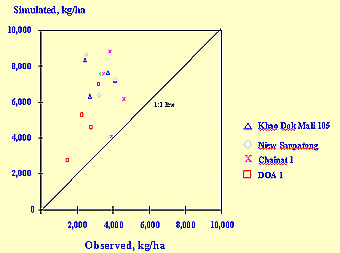 Figure 2
Model Validation
Two separate field experiments were designed to validate the performance of CERES-RICE Model. The first experiment was designed to investigate the response of growth and yield of rice under different planting methods (transplanting and direct seedling)and population density of rice. The second experiment was designed to study the effect of nitrogen application levels and water management regimes on growth and yield of rice. Data collected from both experiment will be used to validate the model. Both experiments are currently carried out at Multiple Cropping Center and Mae Hea Field Station, Chiang Mai University (18o 45’N) and Pitsanulok Rice Research Station (15o 45’N)
References
International Benchmark Sites Network for Agrotechnology Transfer. 1988. Experimental Design and Data Collection Procedures for IBSNAT. The minimum data set for systems analysis and crop simulation. IBSNAT Technical Report 1, Third Edition.Univ. of Hawaii, Honolulu.
Ritchie, J.T., E.C. Alocijia, and G. Uehara. 1986. IBSNAT/CERES Rice Model. Agrotechnology Transfer. 3:1-5.
Tsuji, G.Y., G. Uehara, and S. Balas (ed.). 1994. DSSAT version 3. (3 vol.) Univ. of Hawaii, Honolulu.
Table 1 Genetic parameters estimated from planting date experiments (May-August 1997)
Genetic parameter |
Description |
KDML-105 |
NSPT |
CNT-1 |
DOA1 |
P1 |
Time period (GDD) of basic vegetative phase |
480 |
480 |
530 |
390 |
P2R |
Extent phasic development (GDD) |
1370 |
1370 |
94 |
20 |
P5 |
Time period (GDD) of grain filling phase |
380 |
380 |
360 |
360 |
P2O |
Critital photo period (hour) |
12.7 |
12.7 |
11.9 |
11.9 |
G1 |
Potential spikelet number |
75.0 |
75.0 |
75.0 |
60.0 |
G2 |
Single grain weight |
0.0270 |
0.0280 |
0.0280 |
0.0280 |
G3 |
Tillering coefficient |
1.00 |
1.00 |
1.00 |
1.00 |
G4 |
Temperature tolerance coefficient |
1.00 |
1.00 |
1.00 |
1.25 |
For more information please contact: sakda@chiangmai.ac.th
| MCC
Home |About MCC | Sustainable
Agriculture | Decision Support Systems | Agri-business&Management
|
| Graduate Program | Supporting Units
| Related Links | Search | Publications | Events | CMU Home |