Panosamsak Promburom, Attachai Jintrawet, and Methi Ekasingh
ThaiRice is a graphic user interface (GUI) that is designed to link spatial databases with CERES-Rice model in order to facilitate the selection of target area, management strategies and various scenarios for rice yield prediction and mapping. It is a customized ArcView GIS application using Avenue script that enable Thai language in the display mode (Fig.1).
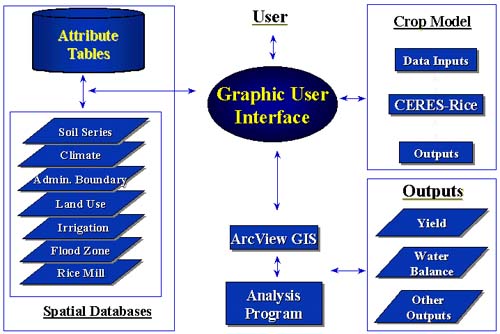
Figure 1 ThaiRice shell structure for RDSS Project.
ThaiRice Functions
| ThaiRice allows a user to select area of interest as from sub-district (tambon) to district (amphoe) and province (changwat) level (Fig.2) or any mapsheet series as indexed by the Royal Thai Survey Department (RTSD). |
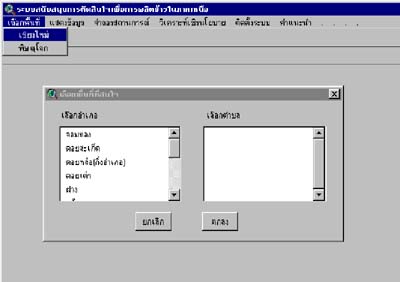
Figure 2 A menu for selecting target area in ThaiRice shell.
| The user can select any of the following spatial data layers in the selected area for displaying (Fig.3): |
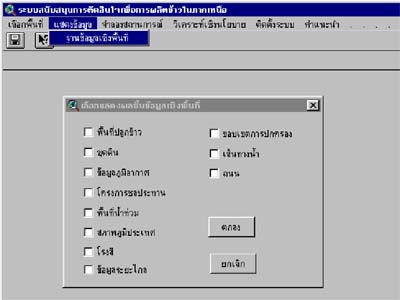
Figure 3. A menu for selecting GIS layers.
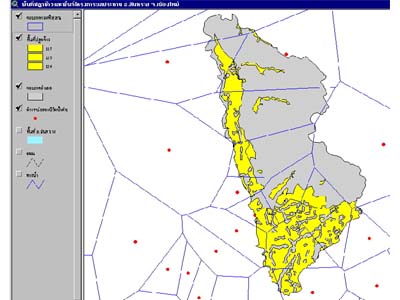
Rice growing areas (Fig.4)
Figure 4. Displaying rice growing area.
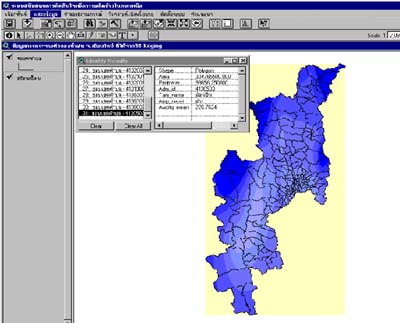
Soil Series Climatic (monthly rainfall amount [Fig.5], and rainy days; mean, maximum and minimum monthly temperature; monthly solar radiation)
Figure 5. Displaying monthly rainfall amount and attribute table data.
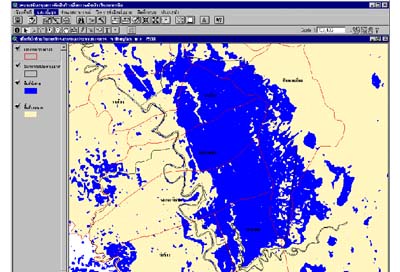
Irrigated areas and structures Flooded zone (Fig.6)
Figure 6. Displaying flooded zone and administrative boundary.
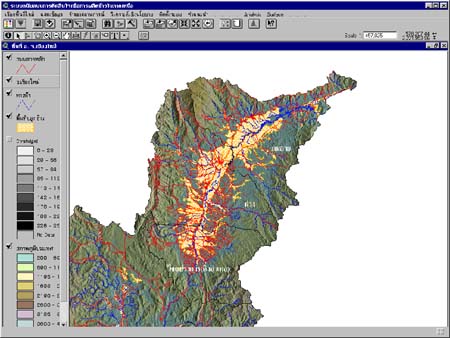
Digital elevation model (DEM, Fig.7) Streams and water bodies (Fig.7) Road networks (Fig.7)
Administrative boundaries (Fig.7)
Figure 7. Displaying multi GIS layers, DEM, streams and road network,
administrative boundary, and rice growing area.
Rice mill
| Different management strategies may be chosen e.g. different levels of nitrogen fertilizers to simulate rice yield (Fig.8). |
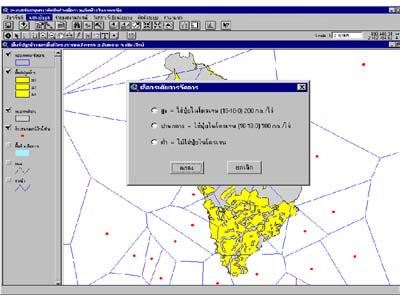
Figure 8. Selecting management strategy to simulate rice yield.
| Rice yield in each mapping unit as simulated by CERES-Rice in the area of interest can be displayed together with its attribute table for detailed information (Fig.9) |
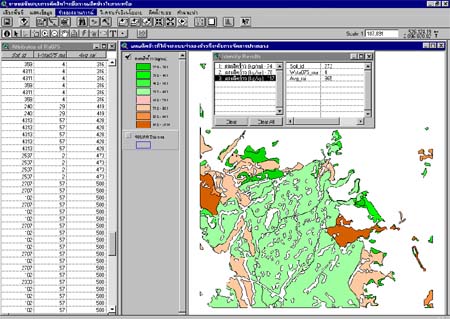
Figure 9. Display simulated yield map and data table.
System Requirements
| Windows 95, Windows NT with Thai language and fonts set. | |
| ArcView 3.0 or above. | |
| Spatial Analysis Extension for ArcView. | |
| Dialog Designer Extension for ArcView. |
For more information, please contact
panomsak promburom.
Back to ThaiRice ![]()