Methi Ekasingh, and Juraiporn Kaewtip
![]()
Methi Ekasingh, and Juraiporn Kaewtip
Daily rainfall are required as a climatic data input for CERES-Rice model. Due to commonly known spatial variation of rainfall, entering daily rainfall records from point stations may introduce an uncertainty to the output of the simulation. Therefore, generating daily rainfall data from point data to rainfall surface are necessary.
In RDSS Project, 306 rainfall stations in and around the study areas (Fig. 1) were first generated as a point coverage in Arc/INFO. Three methods of spatial interpolation were used, Thiessen method and Inverse Distance method were implemented within Arc/INFO, and Kriging method in S-Plus statistical package (Fig. 2). The analysis of root mean square errors (RMSE) of the interrelation of rainfall at the omitted station indicated that Kriging method yielded the lowest RMSE.
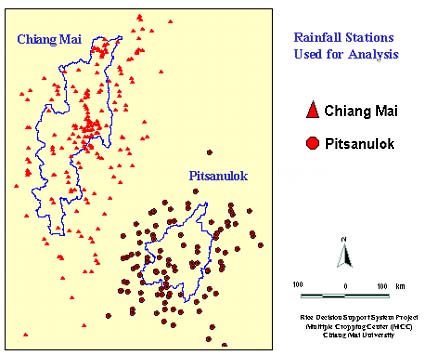
Figure 1 Rainfall station used for analysis in RDSS Project.
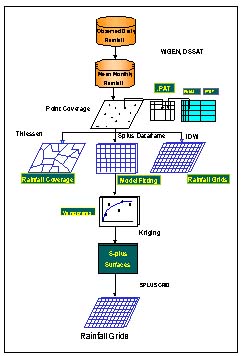
Figure 2 Procedures for generating rainfall surface.
In order to efficiently manage rainfall data in GIS, monthly rainfall surface interpolated above were stored as coverages. They can be displayed as maps of mean monthly rainfall (Fig. 3) and rainy days for each month (Fig. 4). Rainfall zone in form of Thiessen polygons were overlaid on rainfall surfaces created from Kriging method, and rainfall statistics for each zone were estimated using functions in Arc/INFO. The results were stored as attribute tables (Fig. 5) that can be exported into DSSAT for generating daily rainfall data for each zone in the format that is required to run CERES-Rice model.
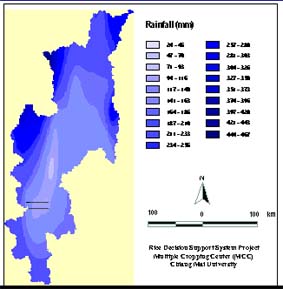
Figure 3 Average monthly rainfall in August, Chaing Mai
Kriging method.
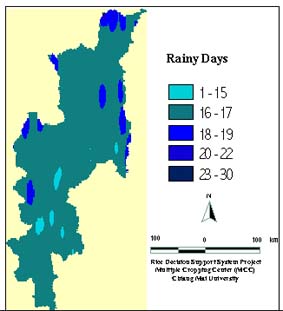
Figure 4 Average number of rainy day in August, Chiang Mai.
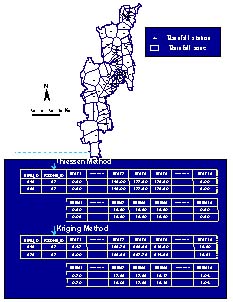
Figure 5 Average monthly rainfall, amount and rainy days
generate from spatial analysis.
For more information please contact: methi@chiangmai.ac.th